Drills app provide detailed shooting report for every session that was made through Drills.
Dry fire statistics
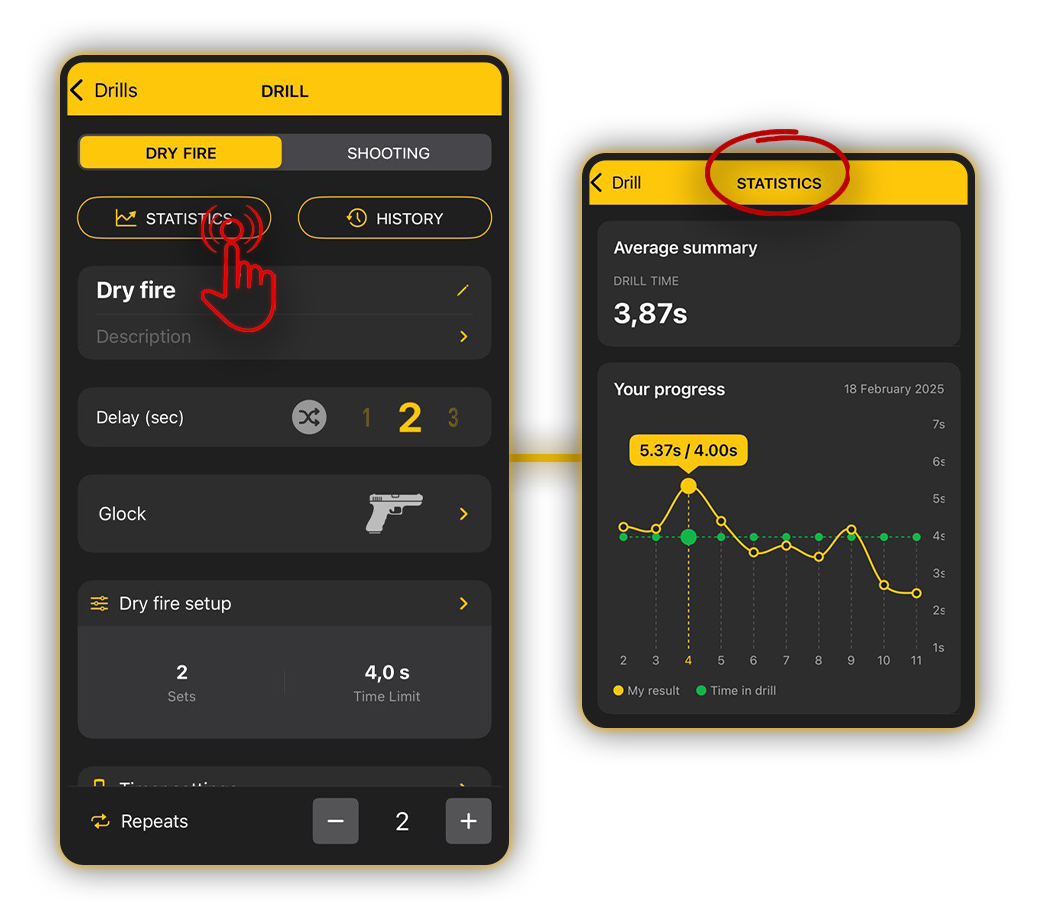
At the top, there is a section that shows the Average summary – it displays the average time of all repetitions in that drill for the entire period.

📈 Yellow curve shows your execution time and the green is the time limit you set. If you decide to change your time limit after some time, it will show on the graph.
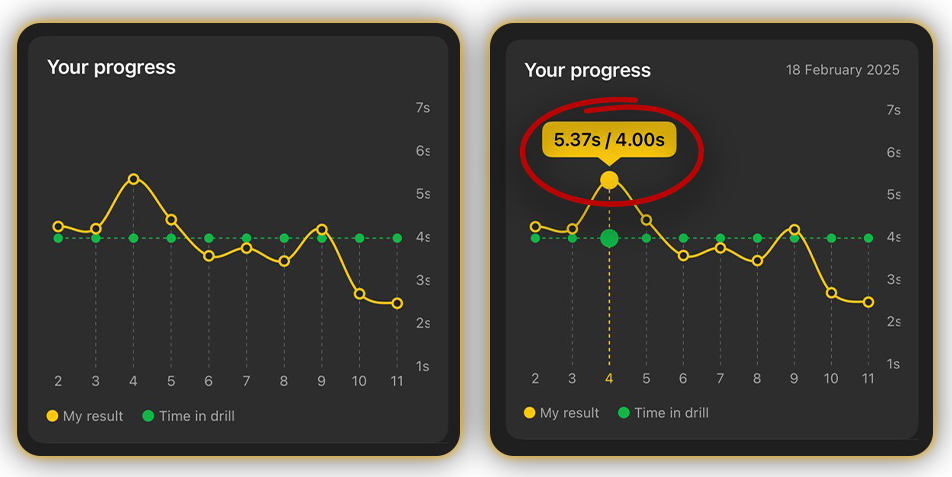
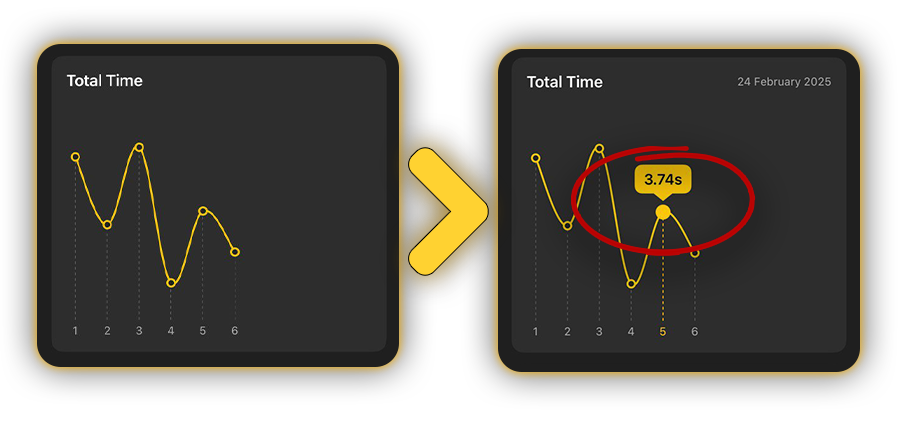
If you tap on the green or yellow dot, you will see your execution time relative to the goal you set, and the date when you trained.
Shooting statistics
Shooting statistics now include more detailed charts and insights. The data visualization adapts based on whether sets or targets are included in your drill, providing a more comprehensive analysis of your performance.
At the top, there is an average summary that includes:
✅ Drill Time;
✅ Average Hit factor;
✅ Average Alpha: percentage of shots went into A zone;
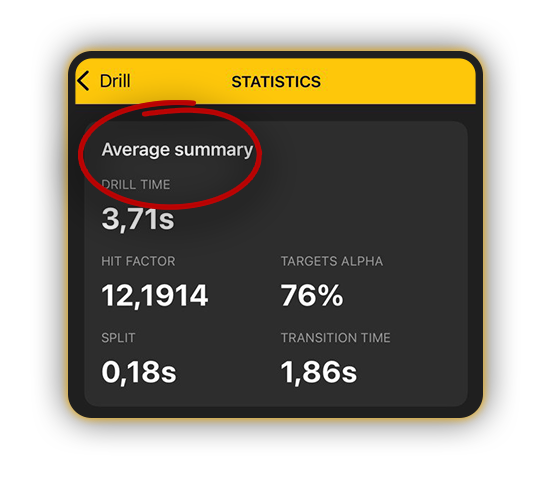
✅ Average Transition time: The average interval which is longer than 0.3 seconds.
For example you have 3 targets. It takes 3 seconds from the last shot into target 1 and first shot into target 2. And your split is 0.27. The average transition time will be 3 seconds.
If the data matches Drill time, Transition time is not shown.
✅ Split: is the average interval which is less than 0.3 seconds of all sessions.
Using the same example, assuming all of your splits are 0.27 and it takes you 3 seconds to transition between targets, the average split will be 0.27.
All other intervals between shots are not considered.
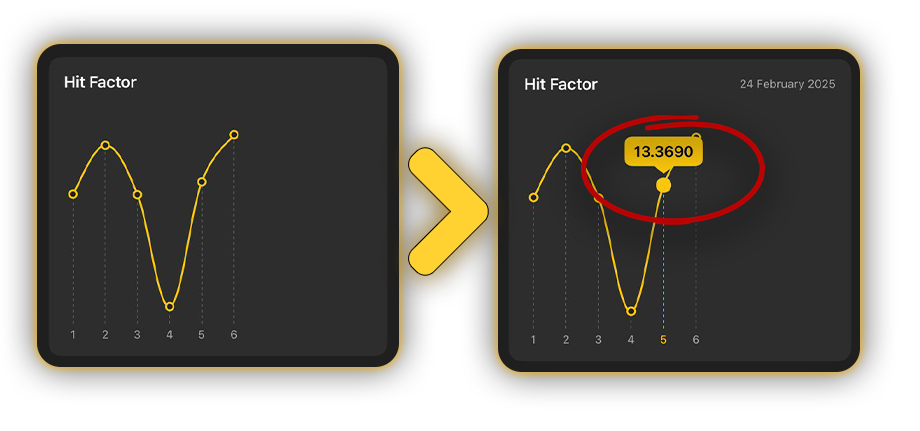
📈 Hit Factor
On the X axis is your drill count. On the Y axis is your hit factor. If you tap the dot, you’ll see the actual number.
📈 The target chart shows your accuracy.
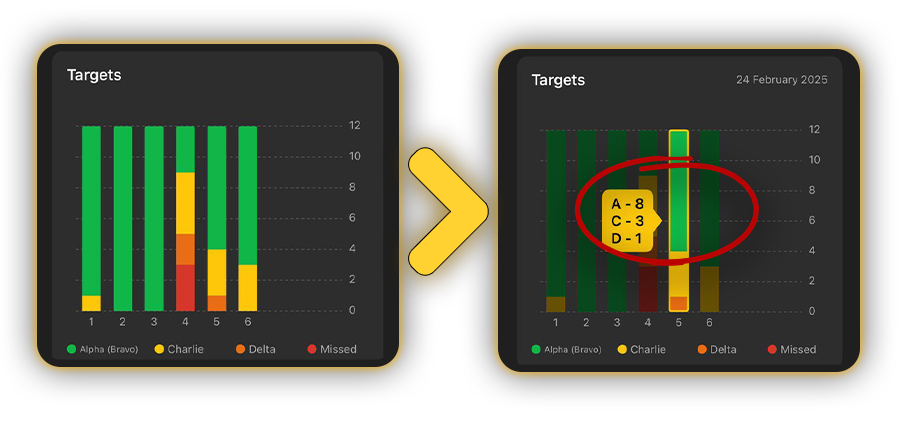
X axis shows your drill count and Y axis is the number of rounds you fired. Colors indicate the ratio of zones on the target these rounds went into. If you tap on the bar you can see the scoresheet of this repetition.
⚠️If you don’t select targets when creating the Drill, the Average Summary will only show split time, drill time, and transition time—hit factor and target stats won’t be displayed, nor will their graphs.
📈 Total time
The third graph is the time you took to complete the drill.
📈 Transition time
is the sum of intervals which are longer than 0.3 seconds.
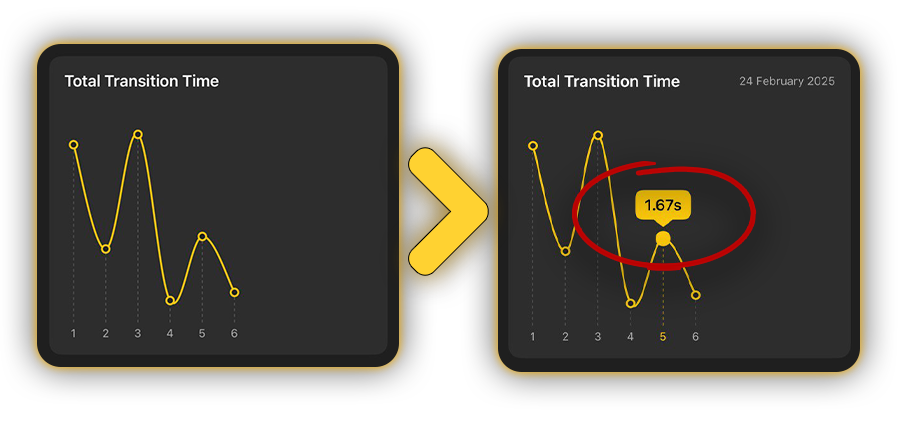
For example you have 3 targets. It takes 3 seconds from the last shot into target 1 and first shot into target 2. And your split is 0.27. The transition time of this session will be 9 seconds.
If the data matches Drill time, Transition time is not shown.
📈 Average split time shows the average interval which is less than 0.3 seconds of one particular session.
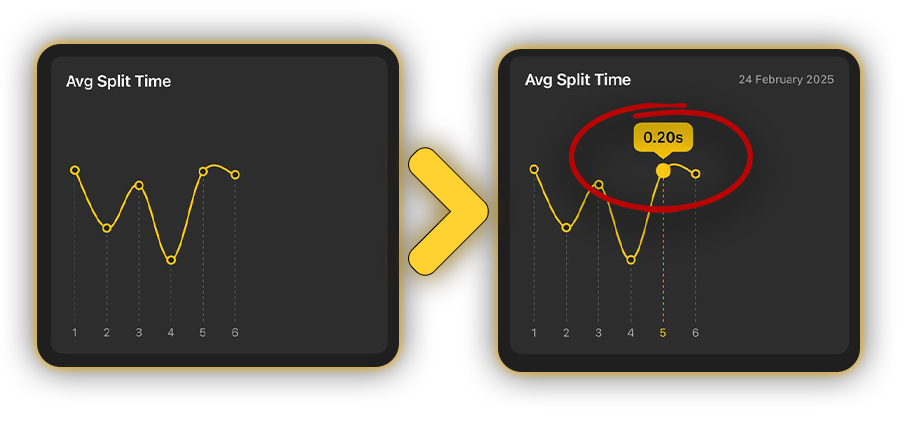
Using the same example, assuming all of your splits are 0.27 and it takes you 3 seconds to transition between targets, the average split will be 0.27.
All other intervals between shots are not considered.
Statistics graphs accessible in multiple ways:
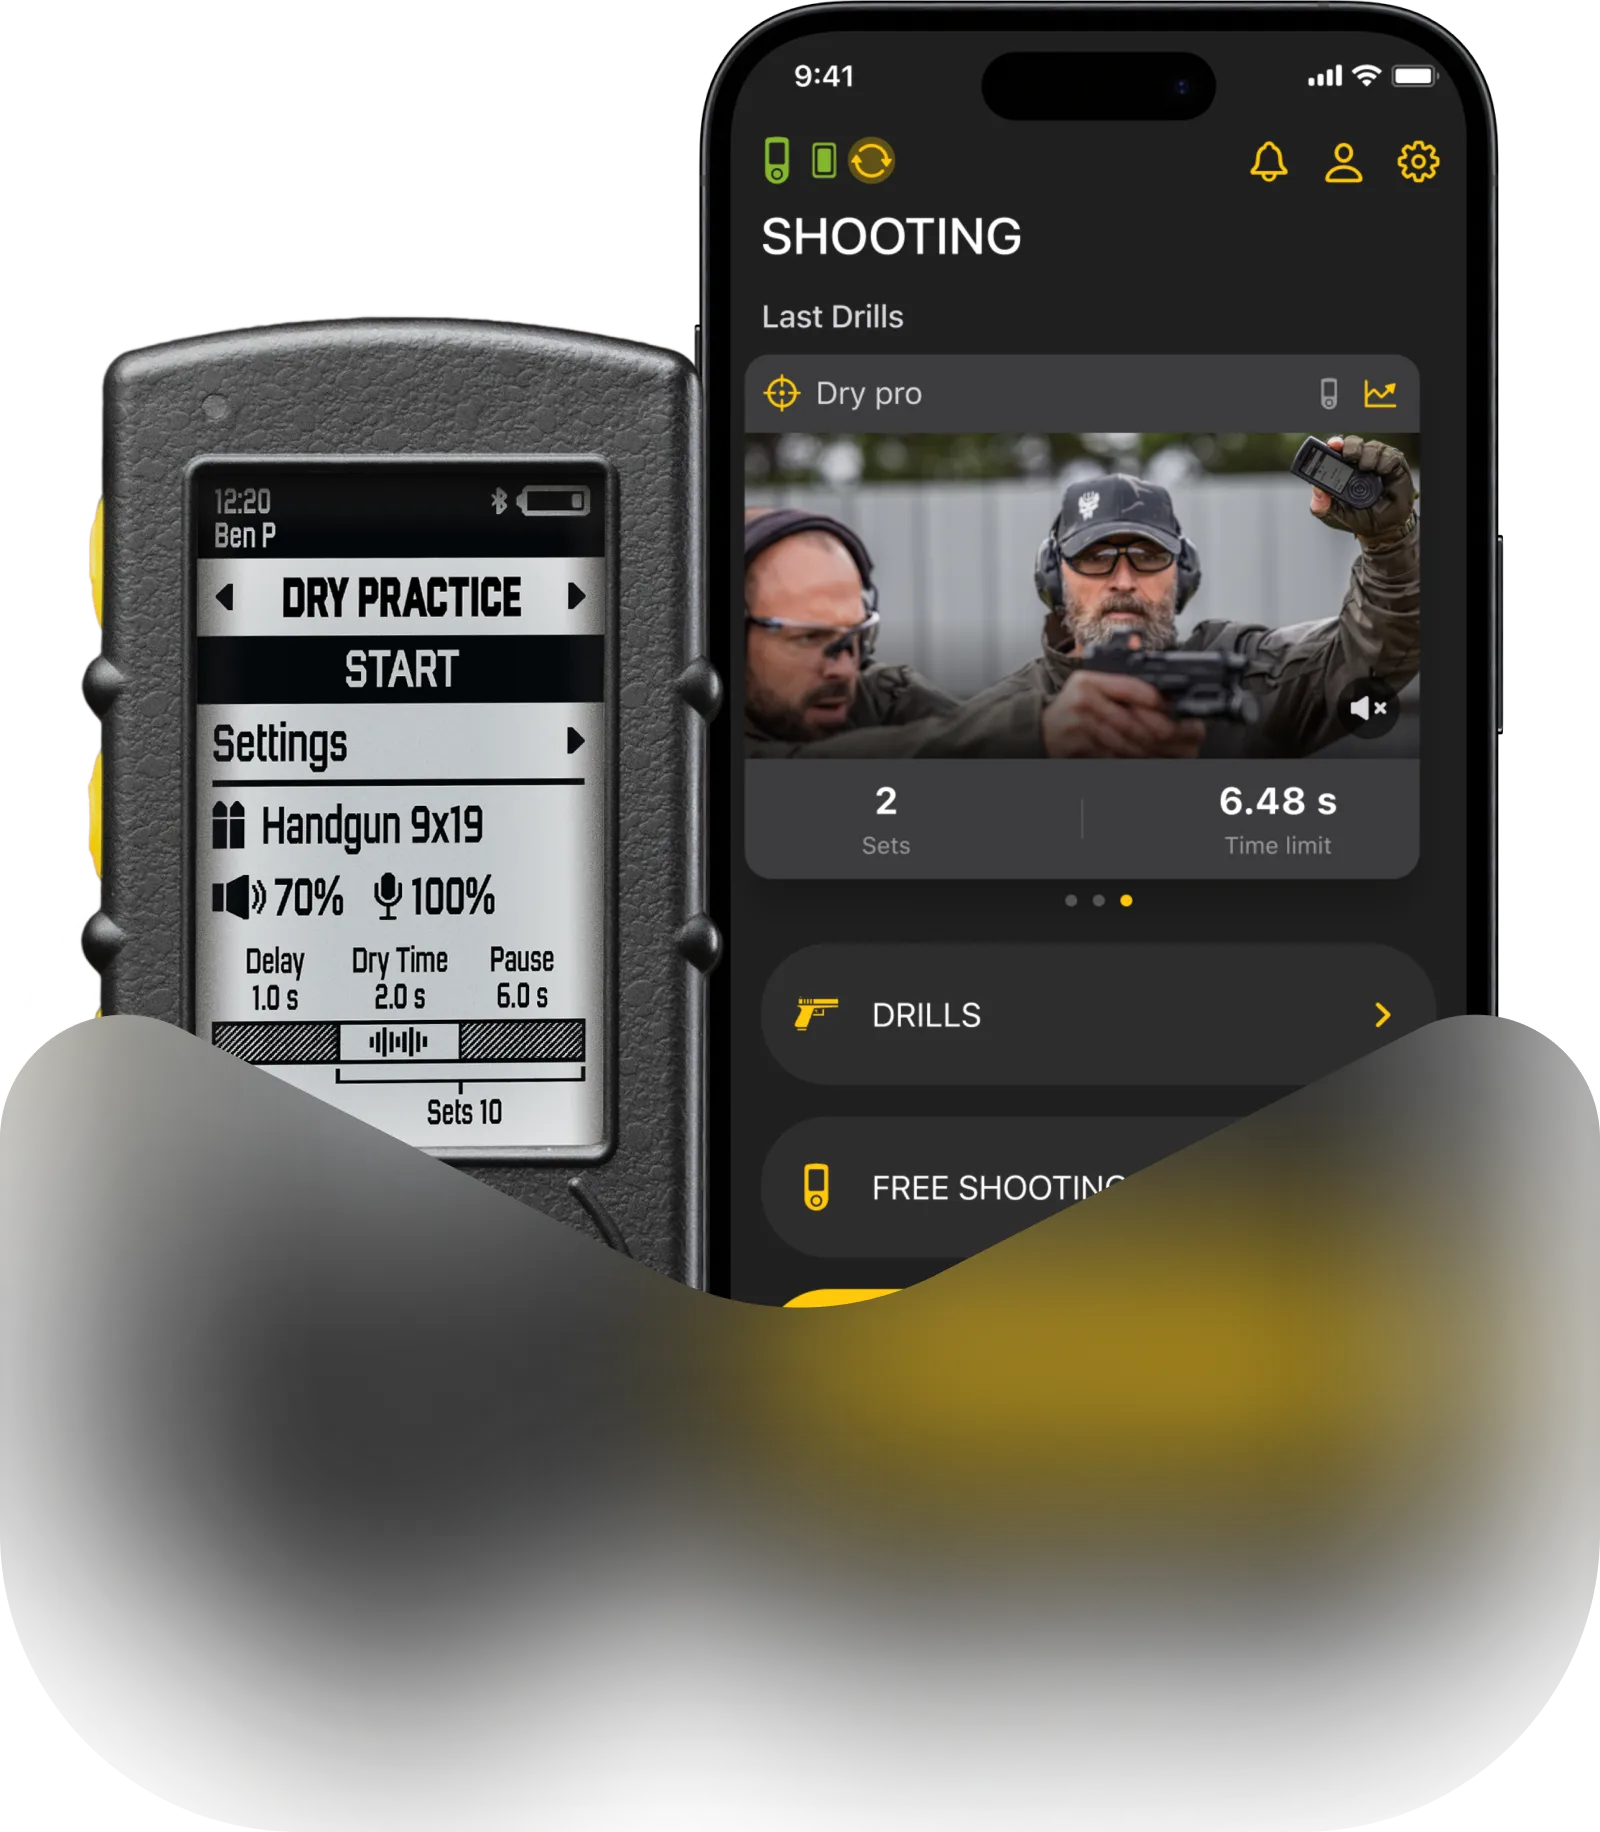
🔸 On the app’s main screen, the three most recent drills are displayed at the top. Tap the chart icon in the upper right corner of a drill card to open its statistics.
🔸 Access statistics from the Drills list, the History menu, or directly from an individual drill by tapping “Statistics.”
🔸 From the Activity menu, select the session from the calendar and tap the chart icon.
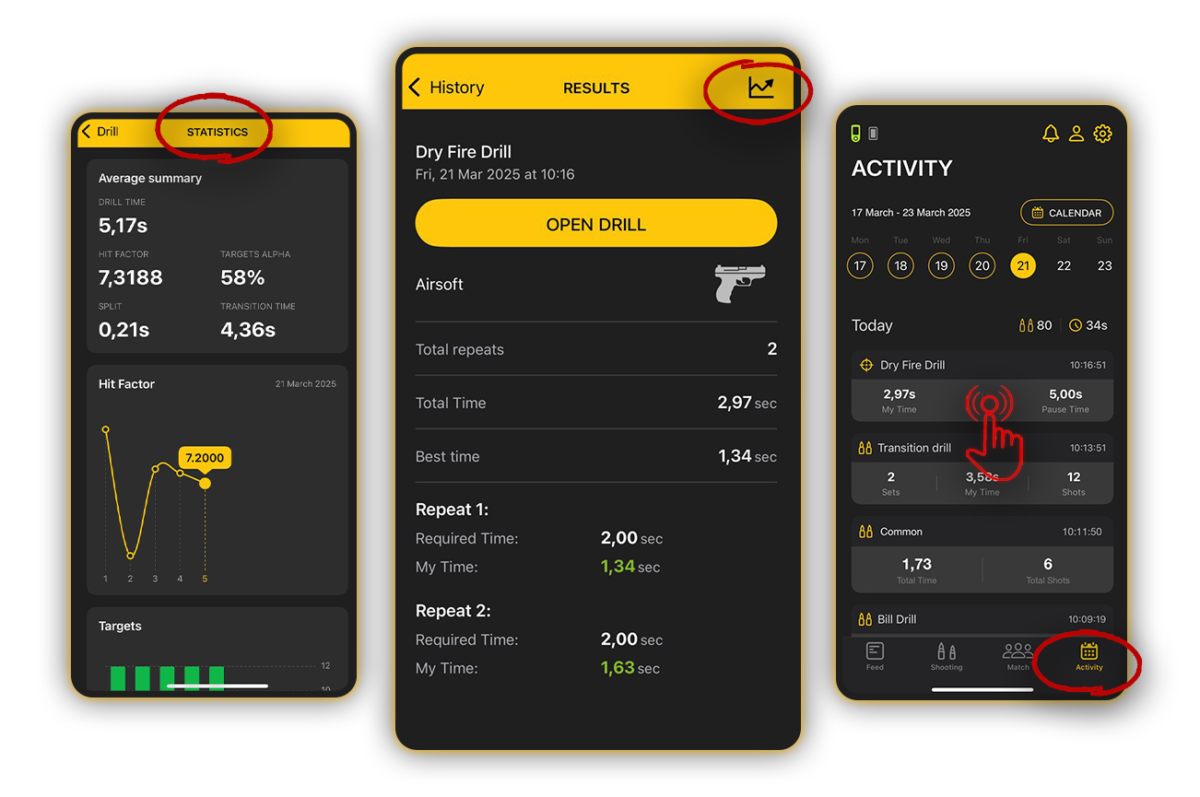
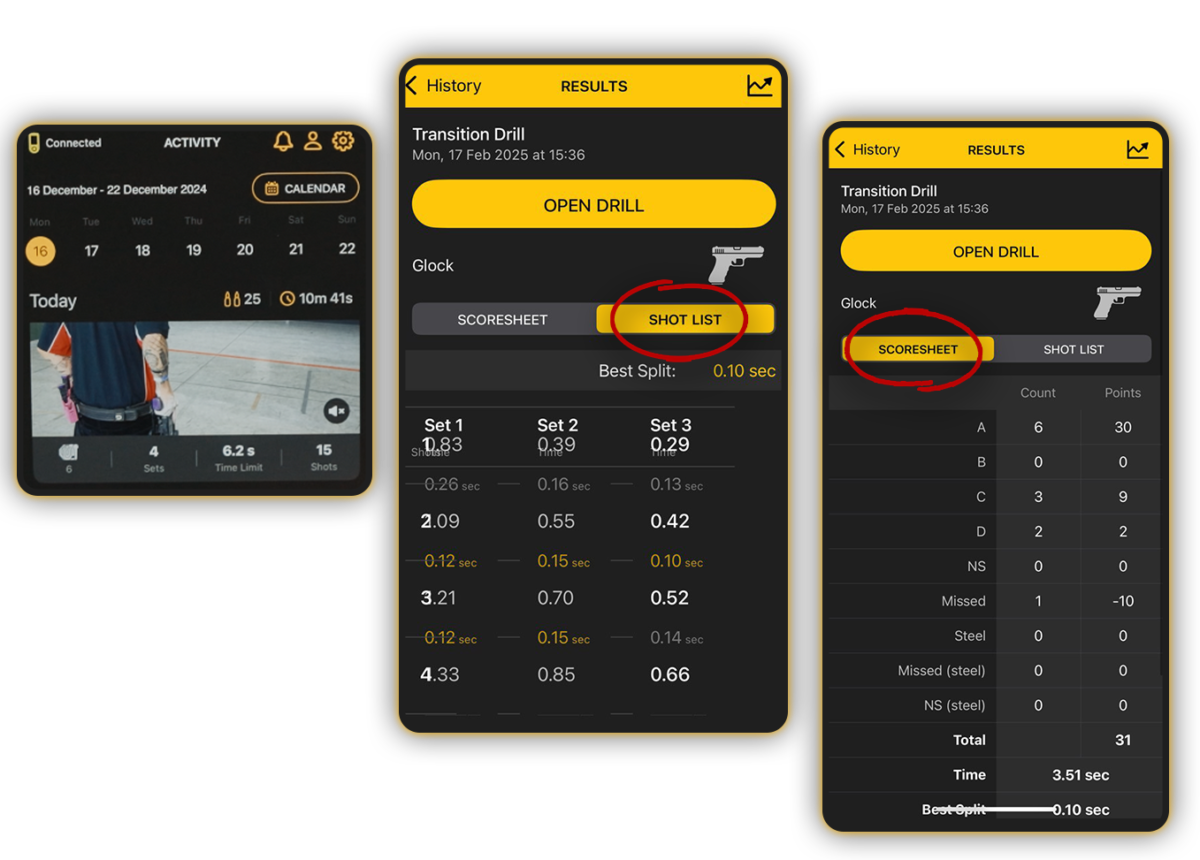
Individual session history
All training sessions made through Drills are also saved in the Activity as regular sessions, where you can review the scoresheet and a shot list with all shot times and splits.
You can access it by selecting History on the Drill screen. It will show only sessions of this particular Drill. Or by going to the Activity menu. Though in this case it will display all training sessions you had on this day, and not only from this Drill.
Your recorded videos will be saved in Activity, Drill history, or Gallery.